The Ultimate Guide to Warehouse Inventory Optimization and Layout Design
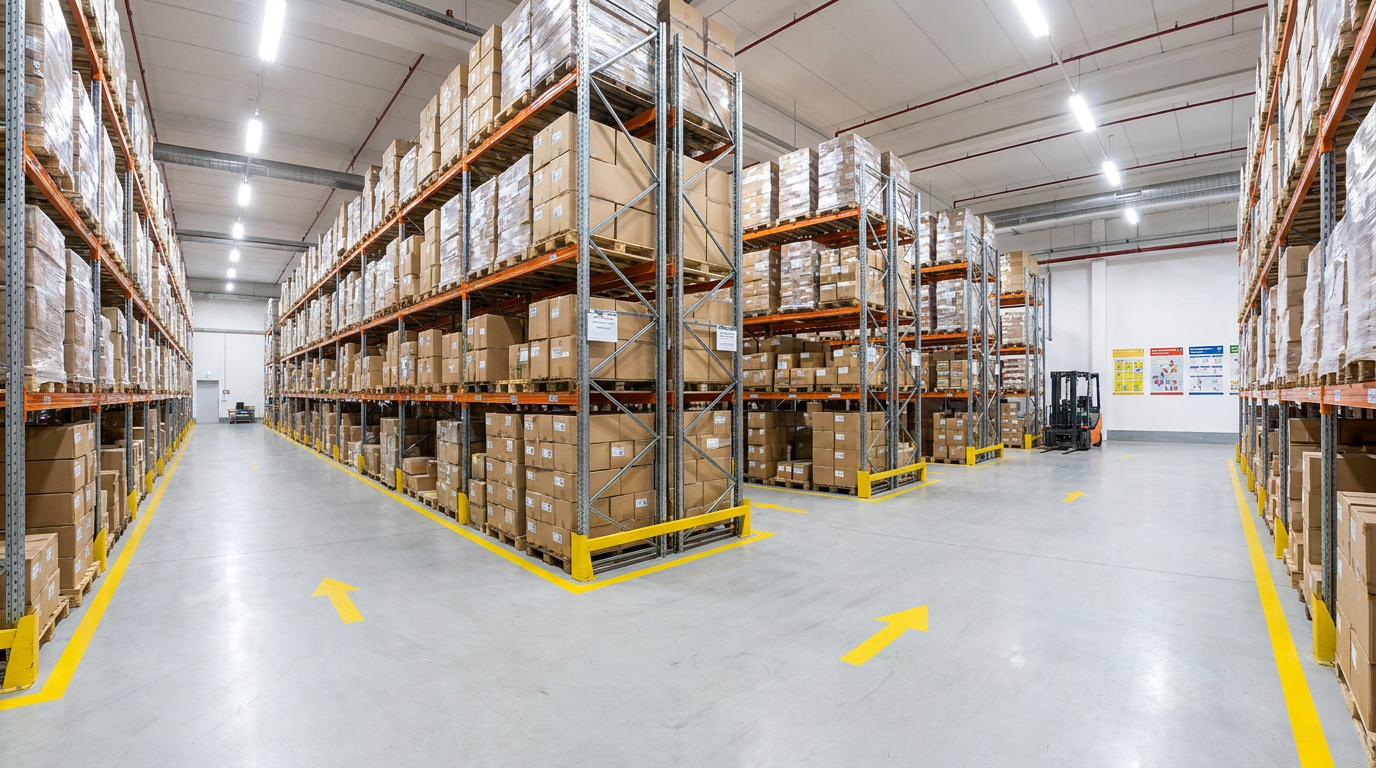
The Ultimate Guide to Warehouse Inventory Optimization and Layout Design
Most inventory issues aren’t due to inadequate space but rather space that’s been poorly assigned, measured imprecisely, and untouched post-installation of the initial setup. The correct approach is to consider your warehouse floor as a numerical asset. In this case, each meter of aisle, rack bay, and staging buffer either contributes to throughput or detracts from it.
Start With An Honest Spatial Audit
First things first, you can’t optimize what you don’t measure. Here’s the standard warehouse utilization formula: Storage Capacity = (Total floor area – non-storage zones) × clear ceiling height – aisle space
Be honest about non-storage zones and give this formula the correct data, and you are likely to amaze yourself at how much available capacity you’ve got. Many businesses use an estimate of non-storage zones they then add as they would like to think, but it’s essential to be brutally honest right here. Offices, restrooms, battery charging bays – those first three selections on the office space planning checklist? They’re not the racking or staging you need to maximize your storage capacity. If a nice simple percentage gives you an estimate of how much non-racking/staging space you’ve factored in, you’re probably overestimating.
Clear ceiling height – this is what usually comes in second for missed warehouse storage capacity. Facilities with 9 meters clear heights that run racking to 4.5 meters are leaving that handsome half-meter capacity premium beguilingly vacant.
But we think enough facility managers have been burned for forgetting this that the awareness is already plenty high. There simply isn’t a justification for not squeezing every cubic inch of capacity as well as it can go. We’ll give you the best of the standard warehouse utilization formula benchmarks anyway: the practical limit for capacity is 80% to 85% full. Push above 85%, and you hit what the industry calls the honeycombing effect – congestion increases, forklift maneuvering becomes compromised, and picking productivity drops faster than you’d expect. That 85% ceiling isn’t a conservative target. It’s a physics constraint.
ABC Analysis: The Foundation Of Any Rational Layout
Once you know your real capacity, you need a methodology for deciding what goes where. ABC analysis – which is built on the principles of the Pareto Principle – classifies your SKU catalog into three tiers based on velocity and value.
-
Class A items make up about 80% of your order volume. These should be stored closest to the shipping docks, at ergonomic picking heights (roughly 600mm to 1500mm from floor level, what specialists refer to as the "golden zone"), and in the widest, most accessible aisles.
-
Class B items fall in the middle – moderate velocity, moderate value. They can cover a slightly longer pick path and sub-optimal rack heights.
-
Class C items either move slowly or are of lower value. These should be placed at the back of the facility, in snug aisles, or in elevated rack positions that require a step or a reach truck.
SKU profiling is the prerequisite to this exercise. You need a minimum of 12 months of order history to conduct a proper velocity analysis, as a seasonal spike can falsely identify a Class A product as a Class B product. If October sales account for 40% of the year’s total for a specific SKU, it doesn’t mean that’s a Class B product – it means it’s a Class A that for two months a year behaves like a Class C. If your peak season isn’t at the end of the year, make sure a full year has passed since your last peak season. The same January-to-October profile will hold.
Another common oversight: Class A placement isn’t only about distance. It’s about the entire pick cycle – travel time, reach height, scan confirmation, and return path. Shave four seconds off each pick and it seems like nothing until you multiply it by 400 picks per day across a team of eight people.
Aisle Design and Material Handling Equipment Trade-Offs
The width of the aisles in your warehouse isn’t something you should just leave up to your architect or warehouse design firm. They are literally a function of the turning radius of the equipment you’re operating.
Wide aisle layouts (3.5 meters and up) give you the flexibility to run standard counterbalance forklifts. These are the big boys you see lumbering around industrial parks everywhere. They’re fast, powerful, and can handle any load you throw at them. Unfortunately, they are also a poor use of your warehouse space. If you’re going to rely on counterbalance forklifts as your primary material handling equipment (MHE) expect to allocate 40-50% of your total footprint just to aisles.
Narrow aisle systems (2.5 – 3 meters) require reach trucks. These are basically stripped-down counterbalance machines with extended forward reach. Reach trucks are slower, require more operator training, and need a much flatter floor to operate on than traditional forklifts. On the other hand, they give you quite a bit of the storage density advantages of very narrow aisle (VNA) systems without the high capital expenditure.
VNA systems (below 1.8 meters) are the perfect solution for some applications. When combined with either man-up order picking or wire-guided turret trucks they can really send your storage density through the roof. However, both the floors (which must meet DIN 15185 tolerances) and the equipment itself are seriously expensive.
The practical approach for most mid-sized operations is a hybrid: wide aisles for Class A zones near the docks, narrow aisles for the B and C storage zones deeper in the facility. This lets you match equipment type to operational requirement rather than standardizing everything around the slowest common denominator.
Standardized Pallets and Racking Structural Integrity
High-bay racking systems are engineered around specific load presumptions. The beam lengths you use are determined by the standard Australian pallet footprint (1165 × 1165mm). The flue spacing you work with is based on that same standard. And the load distribution calculations that the racking manufacturer used when they rated the system also assume that footprint. When you bring in mismatched, damaged, or undersized pallets, you’re not just adding a spoonful of inefficiency into the mix. You’re adding a spoonful of structural variables that the rack wasn’t factored against managing.
Pallet overhang beyond the beam is a cantilever load. Broken stringers concentrate load at unpredictable point(s) on the beam face. A reliable supply of quality-inspected, structurally consistent pallets isn’t a nice-to-have. For distribution centers using high-bay racking, it’s a safety requirement.
Sourcing a Used Pallet in Melbourne from a supplier that grades and inspects before sale can give local operations a cost-effective way to lift their game without paying new-timber prices across their entire pallet pool.
The other safety/flue space pinch point is fire codes. They mandate transverse flue gaps between adjacent pallet loads (the standard reference point is 75mm / 3 inches) and a minimum of 18 inches of clearance below sprinkler heads. Both specifications are built into compliant rack design – but only if your pallets are actually sized and positioned to spec. Oversized loads that creep into flue space don’t just create a compliance issue. They prevent sprinkler water from penetrating to the fire source, which is the entire point of the clearance requirement.
Dock Staging Areas and Inbound Flow Design
The greatest source of warehouse throughput problems is, surprisingly, the shipping and receiving dock. Specifically, inbound goods that block the dock while waiting for a putaway decision trap both receiving and the next inbound shipment, and they are invisible to the WMS until the next inventory cycle count.
The general rule of thumb in layout design is to allocate 15-20% of total square footage to dock staging – inbound, outbound, and cross-docking zones combined. Cross-docking, where incoming goods transfer directly to outbound transport without entering storage, requires dedicated staging lanes that are physically separate from the main storage flow. If your layout doesn’t have clean separation between inbound and outbound staging, the two flows will collide during peak periods.
One structural design point: staging zones should be rectangular, clearly marked, and sized to hold at least one full truck’s worth of inbound or outbound freight. Irregular shapes or zones that get partially consumed by racking create the chronic bottlenecks that operations managers tend to blame on staffing when the real cause is geometry.
FIFO rotation requirements also affect staging design. If your products require FIFO – perishables, time-sensitive stock, or any inventory with expiration or best-before constraints – your racking and flow paths need to support front-to-back loading and picking. Drive-through racking or flow rack systems are the mechanical solution here. A layout that physically prevents FIFO compliance will create both inventory accuracy and product quality problems that no WMS workaround can fully fix.
Picking Path Optimization and Zone Design
Travel time generally makes up around 50-60% of total pick time in traditional warehouses. The most impactful way to optimize it is picking path design. Unfortunately, in many warehouses, picking paths are decided in a rather haphazard manner – or by default.
The typical serpentine (aka snake) routing – walk down one aisle and come back the next, and so on – will actually make sure your pickers cover the most possible space with each trip. In a truly tiny warehouse, it’s probably your best option. In any other scenario, it’s your worst. Because for a large portion of that route, the picker is walking by SKUs they don’t need. The more they have to break pace and stop to grab an item, the less time they’re making optimal speed progress.
Zone picking assigns pickers to defined geographic areas of the warehouse, eliminating cross-facility travel. Batch picking consolidates multiple orders into a single pick run, reducing the total number of trips needed. The most effective approach for high-throughput operations combines both: zone-batch picking, where pickers simultaneously batch multiple orders within their assigned zone before passing consolidated totes to the next zone.
For this to work, the physical layout needs to reflect it. SKUs that are frequently ordered together – complementary items, kit components, commonly bundled products – need to be physically co-located in the same zone. This requires regular analysis of order data to identify co-purchase patterns, and it means your slotting strategy has to be updated as product mix changes.
Using WMS Heat Maps To Make Layout Changes Continuous
No layout is ever gonna be "the one". The best-laid plans of mice, men, and material handling vendors often go for naught when confronted with the messy reality of shifting demand patterns, quarterly additions and discontinuations to the product line, and a massive promotion three months ago that temporarily turned a slow-moving Class C item into a location-picking, name-taking superstar. Or a hero. You get the point.
All that nice SKU data that Warehouse Management Systems keep and shovel into analytics modules isn’t just for analyzing historical data and planning future activities. It’s also a treasure trove of information about current operations. An example of this is high- and low-pick heatmaps, which show where operators are actually going at the bin level and can reveal easily that your most popular spot in the warehouse is surrounded by dead stock.
Quarterly slotting reviews, informed by WMS heat map data, give you the feedback loop needed to keep the layout aligned with actual operations. The goal isn’t to redesign the warehouse every three months. It’s to make targeted re-slotting moves that keep Class A items in Class A positions as product mix evolves.
Treat your layout as a live document. The warehouse that was optimally configured at opening day isn’t optimally configured two years later unless someone has been deliberately maintaining that alignment.